Mapping
Thumbnail image

GRS can create web maps, online dashboards, StoryMaps, and professional maps for publications with your data.
- Web maps
- Dashboards
- StoryMaps
- Hardcopy maps and large format printing
- Professional maps for publications
- Integration into Salesforce application
Service charges
Services start at $23 an hour up to $125 an hour
Examples of Mapping
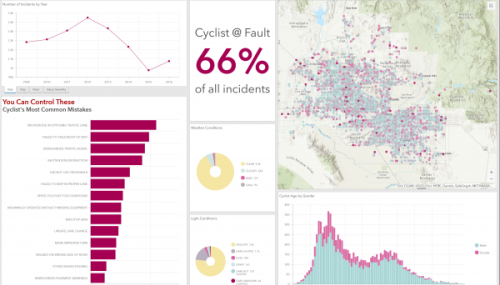
Bike Crashes Dashboard
A dashboard which helps decision makers better understand the data associated with bike crashes in Maricopa County between 2009 and 2016.
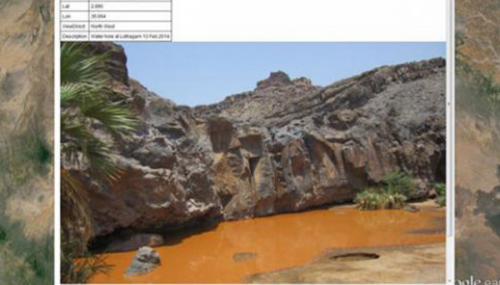
Eviction Mapping
GRS teams up with ASU’s Knowledge Exchange for Resilience to develop the Maricopa County Evictions Dashboard. It tracks and maps eviction data by zip code, models post-pandemic eviction surge potential.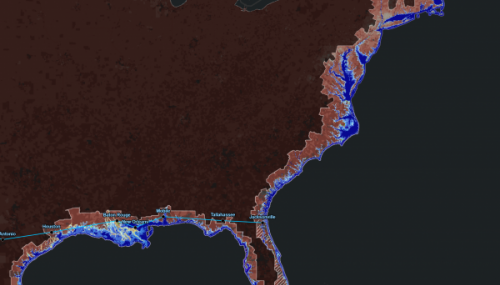
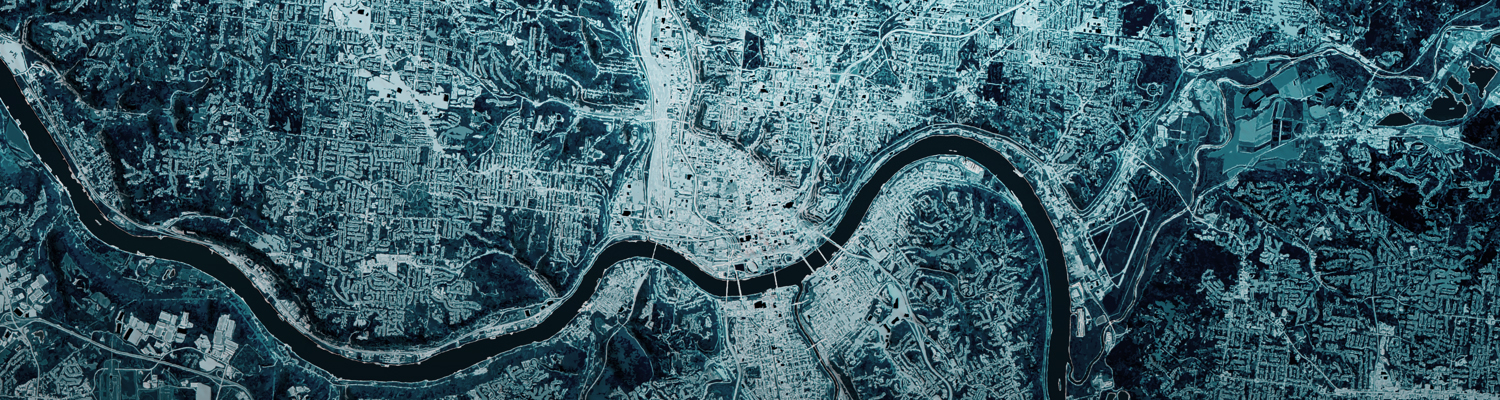
Mapping 10X
GRS designed an exploratory mapping tool for 10X to enhance sustainability and decision-making. It focuses on high-growth cities, particularly addressing sea level rise and social vulnerability for broader global application.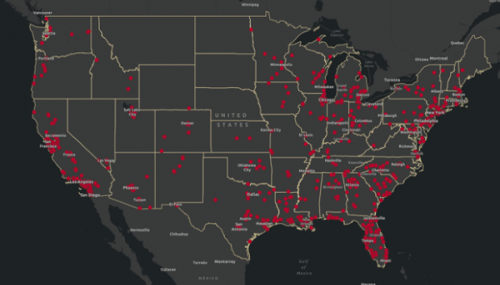
Mapping Cycling Deaths
The 2020 Cycling Deaths project was launched in partnership with the Outside Magazine and Bike Maps. GRS mapped every person on a bike killed by a driver in the U.S. over the course of the year.